Things that require action or are not working are highlighted in red. As the dashboard is primarily for monitoring engineering-related tasks, those are prioritized.
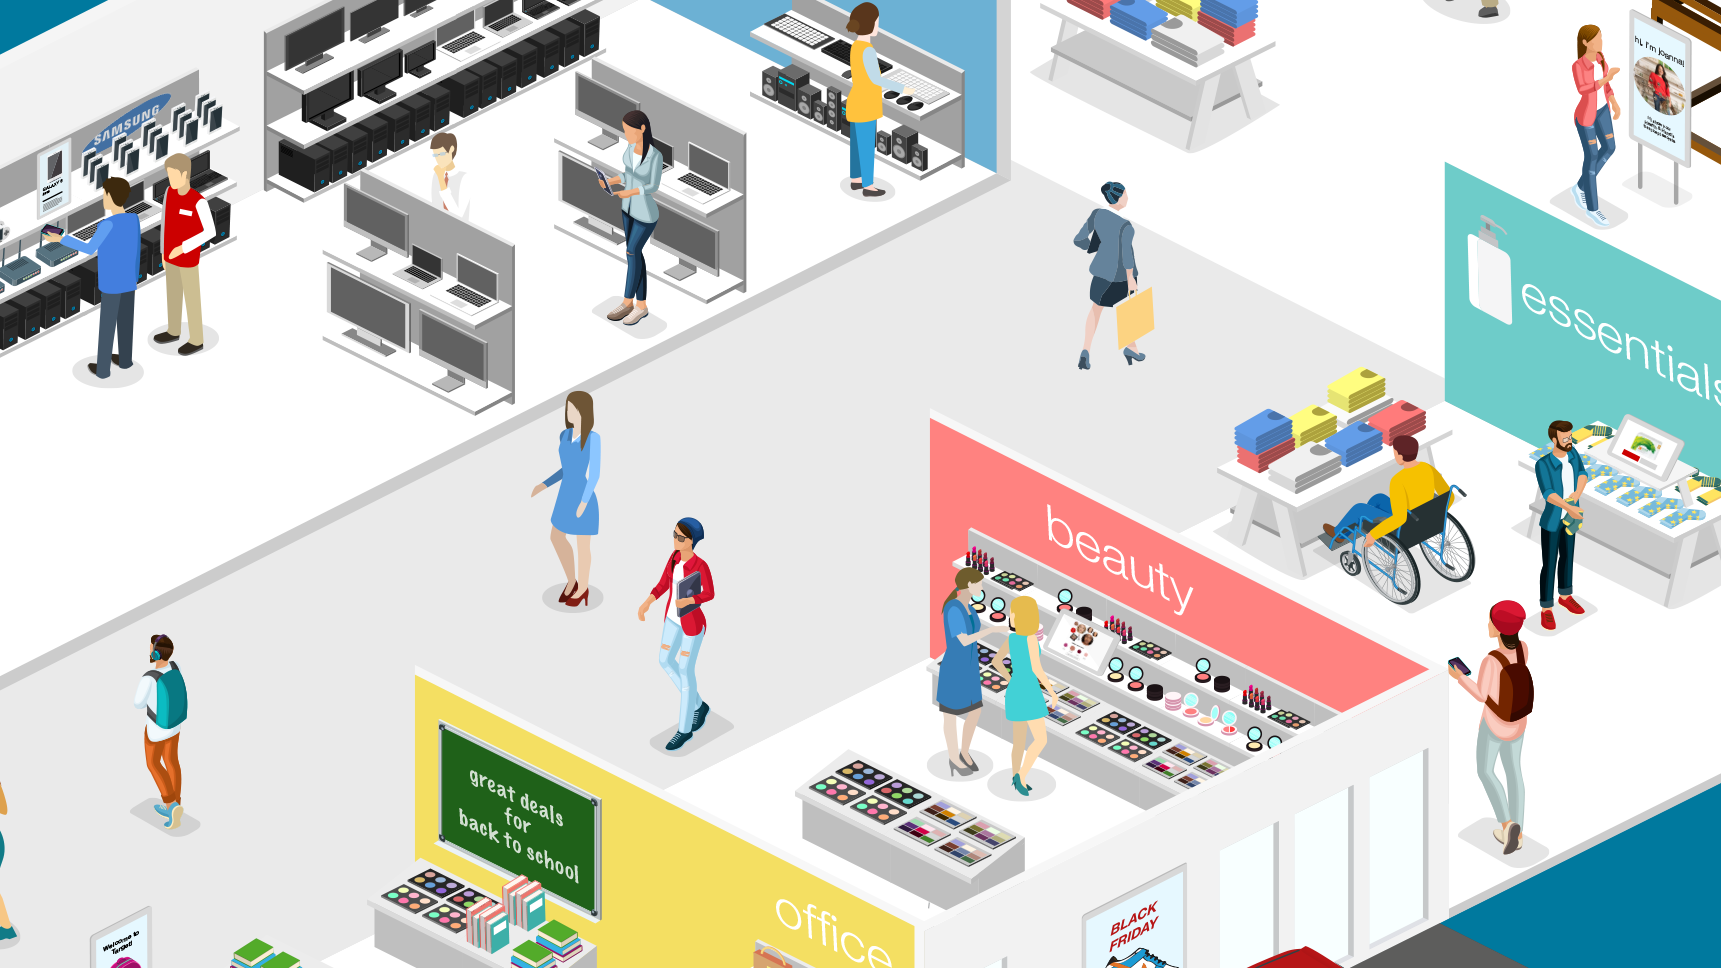
Exploring ways to visualize activity as well as show a store's planogram.
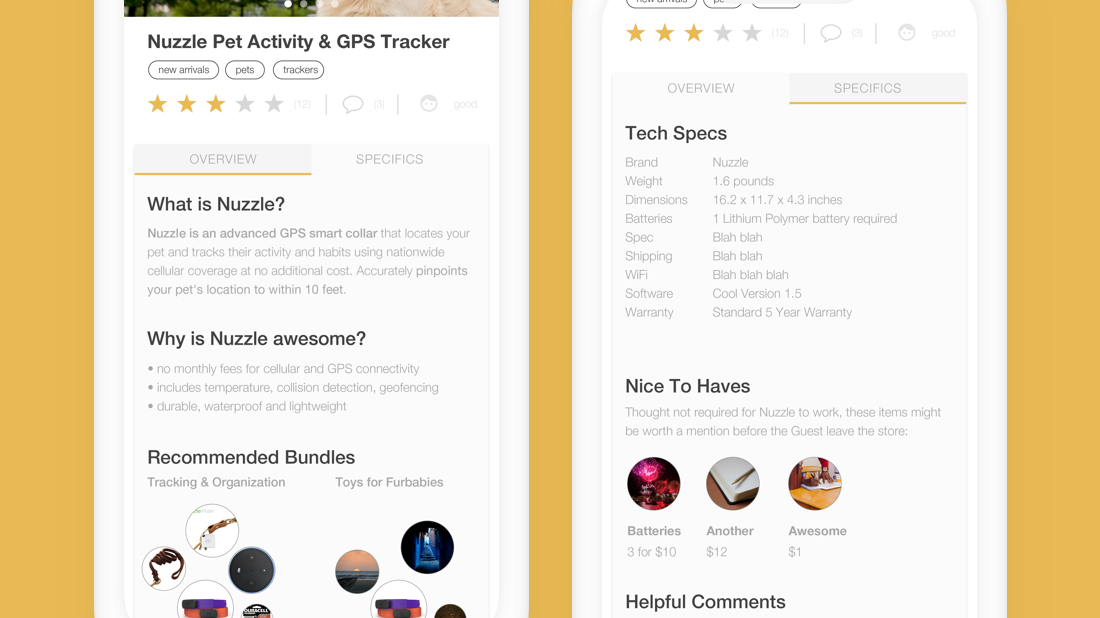
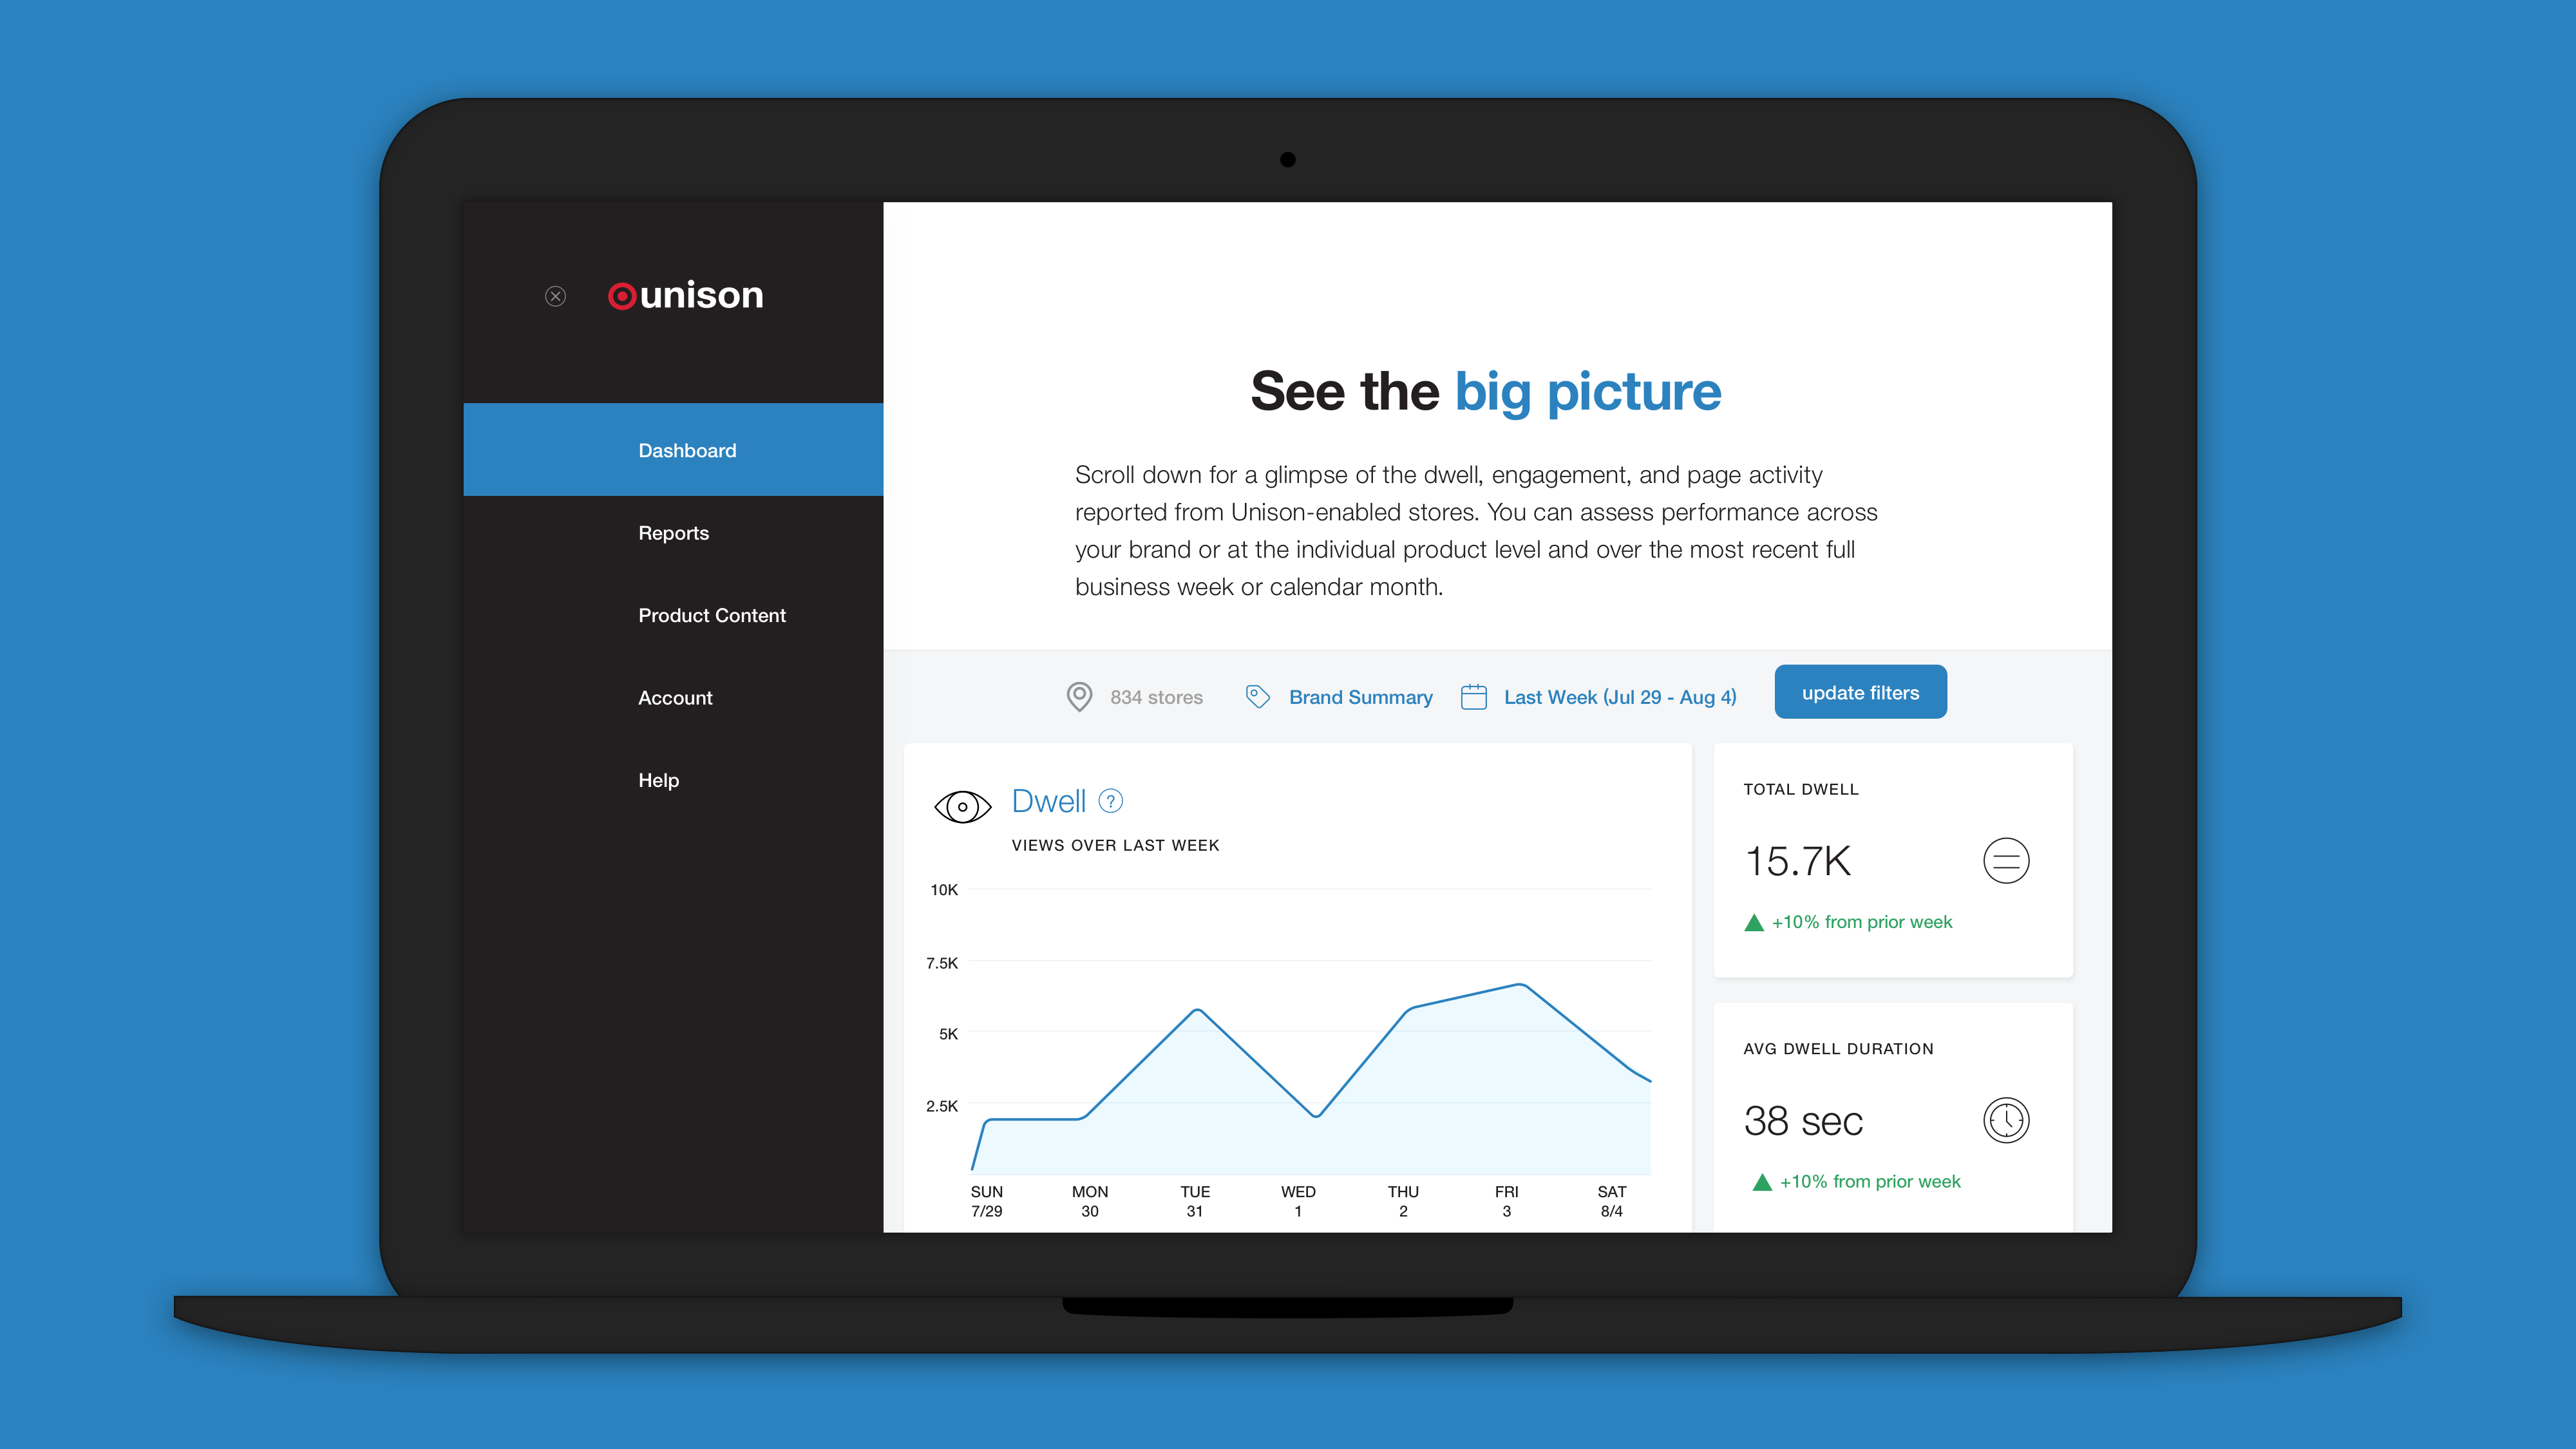
When Unison first began expanding beyond Open House, we began to experience an increased need for monitoring and visibility into what was happening with the tablets and their content in other stores. The two rapid prototypes shown here were designed over the course of a week with the engineering team. The dashboard provides global insight (what's happening for all stores in a region) as well as individual store-level insight. Also included are qualitative comments from TMs and Guests. Disclaimer: All names, images, graphs, and other data are not real and are shown here for illustrative purposes only.
Things that require action or are not working are highlighted in red. As the dashboard is primarily for monitoring engineering-related tasks, those are prioritized.
Exploring ways to visualize activity as well as show a store's planogram.

